[ uniten academic project — ui/ux design ]
your daily routine has a carbon cost. this app puts a number on it.
people contribute to carbon emissions through daily habits but have no easy way to visualise their impact or stay motivated to change. most carbon calculators give one-time estimates — not ongoing tracking or behaviour change tools.
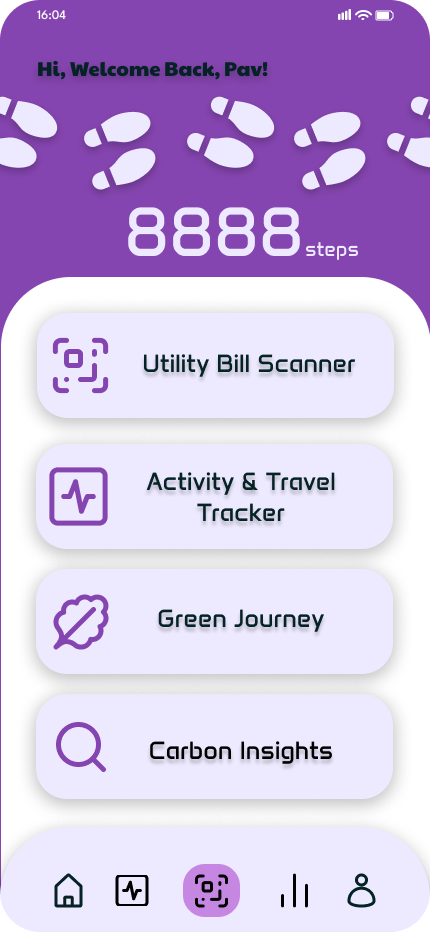
a high-fidelity figma prototype for a mobile app that tracks daily activity emissions (driving, public transport, cycling, electricity), shows a carbon tracker dashboard (daily/weekly/monthly), includes a monthly target system (e.g. 20kg co₂ goal), sustainability missions, and a gamified leaderboard comparing users by state.
leaned into gamification — points, badges, a leaderboard — because research showed it increases sustained engagement more than guilt-based messaging. designed the utility bill scanner feature to reduce manual data entry, a common friction point. applied ucd methodology: user research → personas → journey mapping → wireframes → high-fidelity prototype.
19 screens across the full user journey. demonstrates that a well-designed ux can make complex environmental data feel accessible and motivating rather than overwhelming.
19
screens designed across the full user journey
20kg
monthly CO₂ reduction target built into the prototype
1
gamified experience: leaderboard, missions, and badges built in
 home dashboard
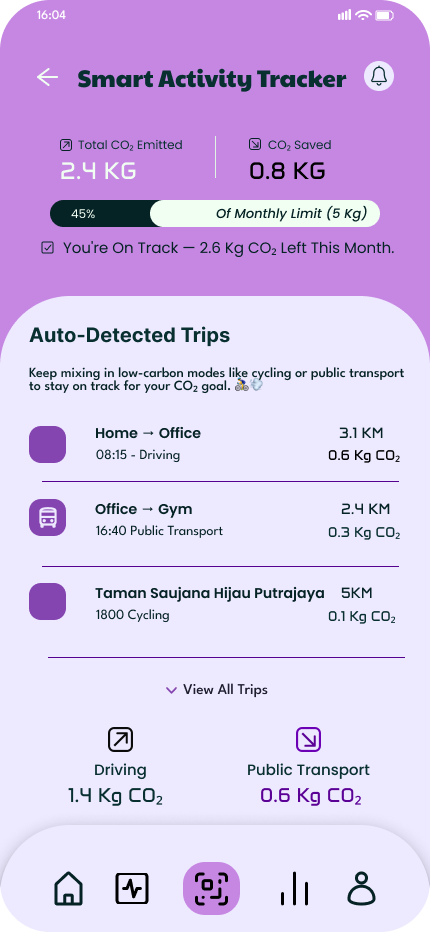 activity tracker
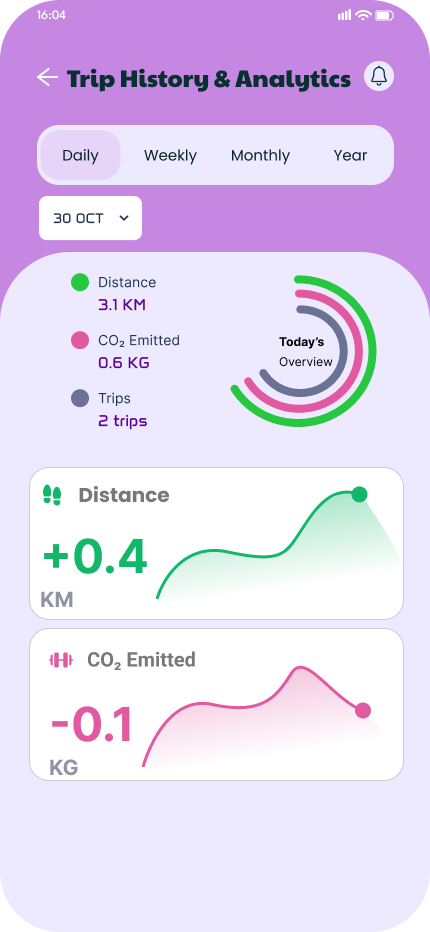 leaderboard
 monthly target